默认情况下,我们能看到的Apache状态总是很少的。
可以使用ps aux|grep httpd查看一些进程信息。
但是Apache处理了多少http请求,以及Apache的性能,我们并不了解。
我们可以使用Cacti这个监控工具来实现对Apache性能的监控。
Cacti需要安装ApacheStats模版。
Apache需要开启Apache Server Status模块。
- 安装Cacti的ApacheStats模板
- 开启Apache的Apache Server Status模块
下面介绍详细步骤。
安装Cacti的ApacheStats模板
首先下载该模板文件。
解压后得到下面内容。
cacti_host_template_webserver_-_apache.xml
ss_apache_stats.php
[caption id="attachment_616" align="aligncenter" width="495"]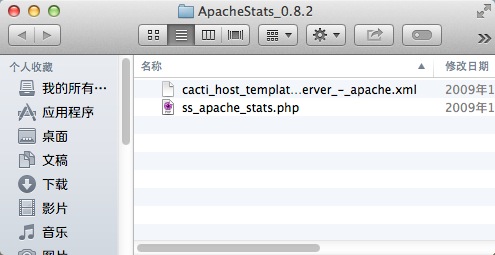 cactiApacheStats[/caption]
将ss_apache_stats.php脚本文件上传至cacti目录下的scripts目录中。
使用浏览器将模板添加至Cacti[Console--Import Templates]。
添加完成后,我们新建设备的时候就可以选择“Webserver-Apache”模板了。
[caption id="attachment_617" align="aligncenter" width="751"]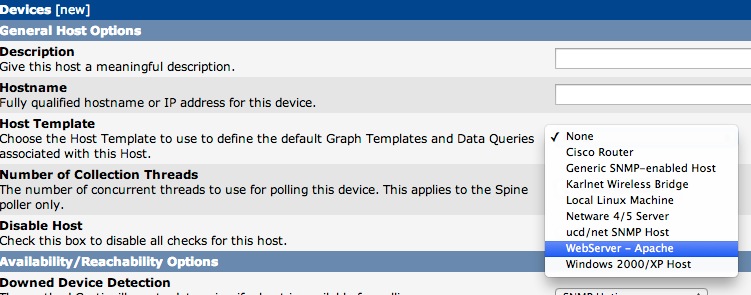 CactiCreateDevice[/caption]
开启Apache的Apache Server Status模块
编辑httpd.conf配置文件。
确保LoadModule mod_status.so
LoadModule status_module modules/mod_status.so
[caption id="attachment_618" align="aligncenter" width="585"]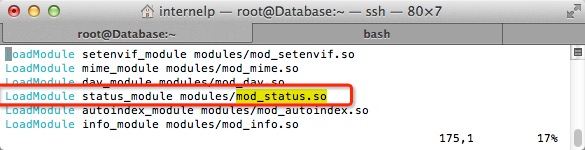 httpd.conf[/caption]
查找ExtendedStatus。去掉注释。
将
#ExtendedStatus On
更改为
ExtendedStatus On
查找server-status,同样去掉前面的注释。
    SetHandler server-status
    Order deny,allow
    Allow from 127.0.0.1
    Deny from all
保存之后重启httpd。
从cacti中添加设备添加图像即可。
[caption id="attachment_620" align="aligncenter" width="837"]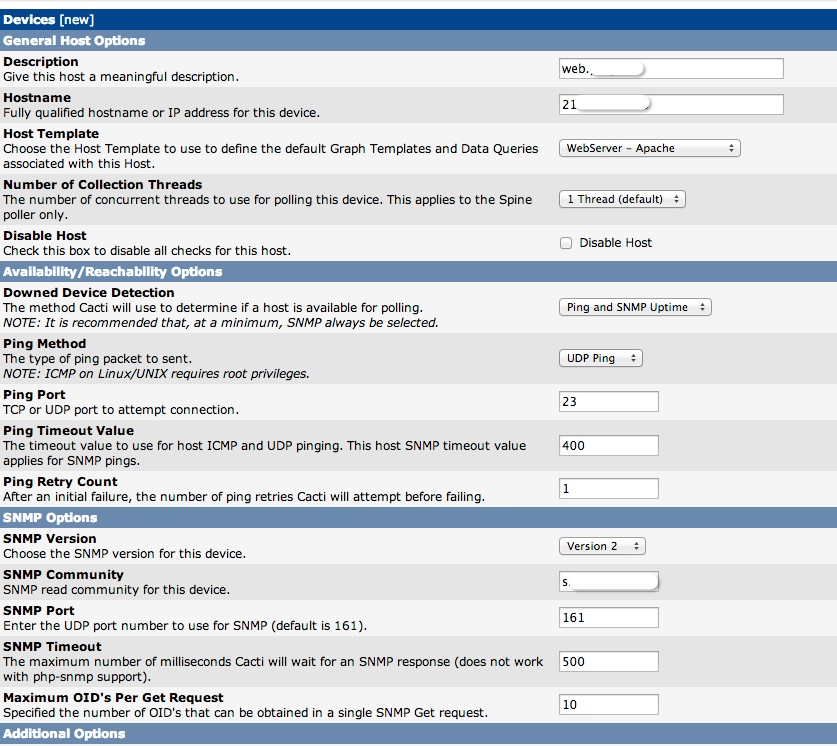 cacti[/caption]
这篇文章还没有人留言,快来抢沙发吧。